Stakeholder Engagement Meeting for Special Education Division 2023
Explore the Stakeholder Engagement Meeting agenda covering topics like graduation, assessment participation, learning environments, and more in the context of Special Education Division 2023. Learn about the State Performance Plan/Annual Performance Report requirements and the role of stakeholders in improving outcomes for students with disabilities.

Download Presentation

Please find below an Image/Link to download the presentation.
The content on the website is provided AS IS for your information and personal use only. It may not be sold, licensed, or shared on other websites without obtaining consent from the author. If you encounter any issues during the download, it is possible that the publisher has removed the file from their server.
You are allowed to download the files provided on this website for personal or commercial use, subject to the condition that they are used lawfully. All files are the property of their respective owners.
The content on the website is provided AS IS for your information and personal use only. It may not be sold, licensed, or shared on other websites without obtaining consent from the author.
E N D
Presentation Transcript
Special Education Division 2023 Stakeholder Engagement Meeting
Todays Agenda Graduation, Dropout and Post-School Outcomes Assessment Participation and Outcomes and Learning Environments (Ages 5 in Kinder to 21) Preschool Learning Environments and Preschool Outcomes (Ages 3-5 in Preschool) Suspensions/Expulsions Parent Involvement Resolution Sessions and Mediations. Investing for tomorrow, delivering today. 2
State Performance Plan/Annual Performance Report In accordance with section 616(b)(2)(C)(ii)(II) of the Individuals with Disabilities Education Act (IDEA), each State must report annually to the Secretary of Education, through the IDEA Part B SPP/APR. Each State is required to submit all Part B Indicators 1-17 of its Federal fiscal year (FFY) 2021 SPP/APR by February 1st. https://www.youtube.com/watch?v=s7pAJNRBQIQ Start video at 15.14 Investing for tomorrow, delivering today. 3
SPP/APR Indicators 2 Types of Indicators: Compliance: OSEP sets targets/requirements which must be met. Target: The State sets targets/requirements the state must strive to meet. Each are identified with a number Target Indicators Compliance Indicators 4b - Suspension/Expulsion by Race/Ethnicity 1 - Graduation 7 - Preschool Outcomes 9 - Disproportionate Representation by Race/Ethnicity 2 - Dropout 8 - Parent Involvement (8) 3 - Assessment Participation and Outcomes 14 - Post-School Outcomes (14) 10 - Disproportionate Representation by Disability Category 4 - Suspension/Expulsion 15 - Resolution Sessions (15) 11 - Child Find (60 Day Timeline) 5 - Learning Environments 16 - Mediation Sessions 12 - Part C to B Transition 6 - Preschool Learning Environments 17 - State Systemic Improvement Plan 13 - Secondary Transition Investing for tomorrow, delivering today. 4
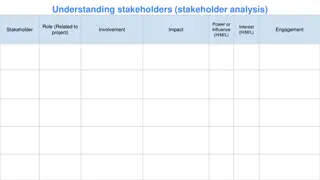
Role of the Stakeholder in the SPP/APR Process As part of the SPP/APR, Stakeholders must be included in the following activities: a. Target setting for SPP/APR indicators b. Analyzing SPP/APR data c. Providing strategies for improving outcomes for children and youth with disabilities, d. Evaluating the progress the State is making Objective for today is: Stakeholders to share feedback and ideas for improving outcomes for students with disabilities. The state will record feedback and share with internal stakeholders that have a role in decision making. Investing for tomorrow, delivering today. 5
Term Review OSEP: Office of Special Education Programs. Oversees the implementation of the Individuals with Disabilities Education Act, Part B IDEA Part B: Individuals with Disabilities Education Act, Part B which outlines the requirements for serving students with disabilities for ages 3-21 SPP/APR: State Performance Plan where the state establishes baselines and targets. Annual Performance Report where the state reports progress on baselines and targets. Indicator: Each requirement reported in the SPP/APR is called and indicator. Each indicator is assigned a number, 1 through 16. Baseline: Data starting point Target: Rate the State has set to meet for each target indicator Met Target: The target the State has established was met or exceeded. Did Not Meet Target: The target the state has established was not met. Lag Year: Data from year prior than reporting. Investing for tomorrow, delivering today. 6
SPP/APR INDICATORS: 1 GRADUATION 2- DROPOUT 14 POST-SCHOOL OUTCOMES
Data reported in the SPP/APR State Charter School Data State Supported School Data School District Data Data Reported in SPP/APR Investing for tomorrow, delivering today. 8
SPP/APR Indicator 1 - Graduation Percent of youth with Individualized Education Programs (IEPs) exiting special education due to graduating with a regular high school diploma. (20 U.S.C. 1416 (a)(3)(A)) Regular high school diploma explanation Miguel Lag year indicator, data from year prior is reported. Investing for tomorrow, delivering today. 9
Information for Indicator 1 - Graduation 2020 to 2025 Calculation Information 2019 and Previous Year Calculation Information State s 4 Year Cohort Rate Federal Exiting Data Calculation: All youth with IEPs who left high school (ages 14-21) Youth with IEPs that (a) graduated with a regular high school diploma + (d) reached maximum age; + (e) dropped out 10
Graduation Rates (Indicator 1) Youth with IEPs (ages 14-21) that graduated with a regular high school diploma FFY 2014 FFYY 2019 4 Year Cohort Graduation Rates FFY 2020-2021 Exiting Graduation Rates 90.00% 80.00% 100.00% 90.98% 77.40% 77.40% 77.40% 77.40% 75.60% 86.46% 73.70% 90.00% 70.00% 65.60% 64.66% 73.83% 73.33% 80.00% 61.85% 61.54% 60.00% 59.32% 56.49% 70.00% 50.00% 60.00% 50.00% 40.00% 40.00% 30.00% 30.00% 20.00% 20.00% 10.00% 10.00% 0.00% 0.00% 2020 2021 2014 2015 2016 2017 2018 2019 Data Target Target State Rate Investing for tomorrow, delivering today. 11
SPP/APR Indicator 1 Considerations Should the state adjust the targets for FFY 2022-2025 to account for possible rule changes? Add other questions from IDC Stakeholder toolkit. Other guiding questions: What do you see? What are your initial thoughts and reactions? Is this what you expected to see? If so, how? If not, why not? What surprises you? Are there particular data that catch your attention (e.g., a certain survey question, student score)? What do these data not tell you? What are the limitations of these data? What do you and other stakeholders need to keep in mind about the data as you review them? Investing for tomorrow, delivering today. 12
SPP/APR Indicator 2 - Dropout Percent of youth with IEPs who exited special education due to dropping out. (20 U.S.C. 1416 (a)(3)(A)) Lag year indicator, data from year prior is reported. Investing for tomorrow, delivering today. 13
Information for Dropout - Indicator 2 Calculation: OSEP did not make changes to Indicator 2 measurements Lag year data used Same data points used as in Indicator 1 All youth with IEPs who left high school (ages 14-21) (a) graduated with a regular high school diploma + (d) reached maximum age + (e) dropped out Investing for tomorrow, delivering today. 14
Dropout Rates (Indicator 2) Number of youth with IEPs (ages 14-21) who exited special education due to dropping out State Drop Out Rates 30.00% 26.94% 25.79% 23.78% 23.75% 25.00% 22.75% 22.84% 22.97% 22.97% 22.97% 20.00% 15.00% 10.57% 10.00% 7.21% 5.00% 0.00% 2016 2017 2018 2019 2020 2021 Data Target Investing for tomorrow, delivering today. 15
SPP/APR Indicator 2 Considerations Should the state adjust the targets for FFY 2022-2025 to account for possible rule changes? Other guiding questions: What do you see? What are your initial thoughts and reactions? Is this what you expected to see? If so, how? If not, why not? What surprises you? Are there particular data that catch your attention (e.g., a certain survey question, student score)? What do these data not tell you? What are the limitations of these data? What do you and other stakeholders need to keep in mind about the data as you review them? Investing for tomorrow, delivering today. 16
SPP/APR Indicator 14 Post-School Outcomes Percent of youth who are no longer in secondary school, had IEPs in effect at the time they left school, and were: A. Enrolled in higher education within one year of leaving high school. B. Enrolled in higher education or competitively employed within one year of leaving high school. C. Enrolled in higher education or in some other postsecondary education or training program; or competitively employed or in some other employment within one year of leaving high school. (20 U.S.C. 1416(a)(3)(B)) New OSEP requirements: Non-response bias Representativeness by race/ethnicity A new component for representativeness by the State s choosing Investing for tomorrow, delivering today. 17
Post School Outcomes (Indicator 14) C. Enrolled in higher education or some other postsecondary education or training program; or competitively employed or in some other employment B. Enrolled in higher education or competitively employed. A. Enrolled in higher education. 14 C Formula: 14 A Formula: 14 B Formula: # of youth who are no longer in secondary school, had IEPs in effect at the time they left school and were enrolled in higher education, or in some other postsecondary education or training program; or competitively employed or in some other employment # of youth who are no longer in secondary school, had IEPs in effect at the time they left school and were enrolled in higher education within one year of leaving high school # of youth who are no longer in secondary school, had IEPs in effect at the time they left school and were enrolled in higher education or competitively employed within one year of leaving high school # of respondent youth who are no longer in secondary school and had IEPs in effect at the time they left school # of respondent youth who are no longer in secondary school and had IEPs in effect at the time they left school # of respondent youth who are no longer in secondary school and had IEPs in effect at the time they left school Investing for tomorrow, delivering today. 18
Post School Outcomes (Indicator 14A) Enrolled in higher education 60.00% 49.00% 49.00% 49.00% 49.00% 49.00% 49.00% 50.00% 43.26% 42.85% 41.13% 40.01% 36.80% 40.00% 35.61% 31.95% 30.28% 30.28% 30.00% 30.78% 20.00% 10.00% 0.00% 2014 2015 2016 2017 2018 2019 2020 2021 State Data Target Re-established targets in 2020. Investing for tomorrow, delivering today. 19
Post School Outcomes (Indicator 14B) Enrolled in higher education or competitively employed 82.00% 80.00% 78.00% 76.00% 74.00% 72.00% 70.00% 68.00% 66.00% 64.00% 2014 2015 2016 2017 2018 2019 2020 2021 State Data Target Investing for tomorrow, delivering today. 20
Post School Outcomes (Indicator 14C) Enrolled in higher education or other post-secondary education or competitively employed or other employment 84.00% 83.00% 82.00% 81.00% 80.00% 79.00% 78.00% 77.00% 76.00% 75.00% 74.00% 73.00% 2014 2015 2016 2017 2018 2019 2020 2021 State Data Target Investing for tomorrow, delivering today. 21
SPP/APR Indicator 14 Considerations Ideas for increasing response rates? Other guiding questions: What do you see? What are your initial thoughts and reactions? Is this what you expected to see? If so, how? If not, why not? What surprises you? Are there particular data that catch your attention (e.g., a certain survey question, student score)? What do these data not tell you? What are the limitations of these data? What do you and other stakeholders need to keep in mind about the data as you review them? Investing for tomorrow, delivering today. 22
SPP/APR INDICATORS: 3 ASSESSMENT PARTICIPATION AND OUTCOMES 5 LEARNING ENVIRONMENT
SPP/APR Indicator 3 Assessment Participation and Outcomes Participation and performance of children with IEPs on statewide assessments: A. Participation rate for children with IEPs. B. Proficiency rate for children with IEPs against grade level academic achievement standards. C. Proficiency rate for children with IEPs against alternate academic achievement standards. D. Gap in proficiency rates for children with IEPs and all students against grade level academic achievement standards. (20 U.S.C. 1416 (a)(3)(A)) The State received a waiver from administering statewide assessments in FFY2019 due to the COVID 19 pandemic For FFY2020, the State received a waiver from meeting the 95% participation rate requirement Investing for tomorrow, delivering today. 24
Indicator Changes and Additions by OSEP 2019 and Previous Years 2020 Indicator 3A - Participation Rates in Statewide Assessments No Indicator 3A Indicator 3B Proficiency Rates on Reading and Math Statewide Assessments Indicator 3C Proficiency Rates on Reading and Math Alternate Assessments Indicator 3D Gap in Proficiency Rates between Students with IEPs and All Students Indicator 3B Participation Rates in Statewide Assessments Indicator 3C Outcomes on Reading and Math Statewide Assessments NEW No Indicator 3D NEW All Grades Calculated in One Rate. Grades Separated By Grades 4, 8 and High School for each Indicator NEW
Statewide Assessment Participation (Indicator 3A) Formula: A.Participation rate for children with IEPs. Reading and Math statewide assessments OSEP Changes OSEP requires data be separated by grades 4, 8 and High School In New Mexico, High School is grade 11 only as approved in the State ESSA plan High School = Grade 11 # of children with IEPs participating in an assessment total # of children with IEPs enrolled during the testing window Investing for tomorrow, delivering today. 26
State Assessment Participation Rate (Indicator 3A) Assessment Participation Rates in Reading and Math All Grades 102.00% 100.00% 98.00% 96.00% 94.00% 92.00% 90.00% 88.00% 2014 2015 2016 2017 2018 Reading Math Target Investing for tomorrow, delivering today. 27
State Assessment Participation Rate (Indicator 3A) Reading Assessment Participation Rates for Students with Disabilities FFY 2020 Target 95.00% 95.00% 95.00% FFY 2020 Data* 6.50% 6.17% 4.06% FFY 2021 Target 95.00% 95.00% 95.00% Grade Grade 4 Grade 8 Grade HS FFY 2021 Data 92.47% 89.38% 75.45% Math Assessment Participation Rates for Students with Disabilities FFY 2020 Target Grade 4 95.00% Grade 8 95.00% Grade HS 95.00% Waiver from meeting the 95.00% requirement in 2020. FFY 2020 Data* 7.71% 6.23% 4.07% FFY 2021 Target 95.00% 95.00% 95.00% Grade FFY 2021 Data 92.59% 89.16% 75.48% Investing for tomorrow, delivering today. 28
Statewide Assessment Proficiency Rates (Indicator 3B) Formula: B. Proficiency rate for children with IEPs against grade level academic achievement standards. Reading and Math statewide assessments OSEP Changes OSEP requires data be separated by grades 4, 8 and High School In New Mexico, High School is grade 11 only as approved in the State ESSA plan High School = Grade 11 # of children with IEPs scoring at or above proficient against grade level academic achievement standards total # of children with IEPs who received a valid score and for whom a proficiency level was assigned for the regular assessment Investing for tomorrow, delivering today. 29
State Assessment Reading Proficiency Rate (Indicator 3B) Reading and Math Proficiency Rates All Grades 70.00% 60.00% 50.00% 40.00% 30.00% 20.00% 10.00% 0.00% 2014 2015 2016 2017 2018 Reading Reading Target Math Math Target Investing for tomorrow, delivering today. 30
State Assessment Proficiency Rate (Indicator 3B) Reading Assessment Proficiency Rates for Students with Disabilities Grade Grade 4 Grade 8 Grade HS FFY 2020 Data 23.57% 11.44% 21.34% FFY 2021 Target 8.41% 7.06% 3.32% FFY 2021 Data 8.41% 7.06% 6.32% Math Assessment Proficiency Rates for Students with Disabilities Grade Grade 4 Grade 8 Grade HS FFY 2020 Data 2.47% 2.09% 9.35% FFY 2021 Target 6.00% 2.84% 1.99% FFY 2021 Data 6.00% 2.84% 1.93% Investing for tomorrow, delivering today. 31
Statewide Assessment (Indicator 3) C. Proficiency rate for children with IEPs against alternate academic achievement standards. New indicator in FFY2020 Formula # of children with IEPs scoring at or above proficient against alternate academic achievement standards total # of children with IEPs who received a valid score and for whom a proficiency level was assigned for the alternate assessment Investing for tomorrow, delivering today. 32
State Assessment Proficiency vs. Alternate Assessment Proficiency (Indicator 3C) Reading Assessment Proficiency vs. Alternate Assessment Proficiency Rates for Students with Disabilities FFY 2020 Data 7.69% 7.55% 35.71% FFY 2021 Data 15.21% 25.39% 32.92% FFY 2021 Target 8.14% 8.00% 36.16% Grade Grade 4 Grade 8 Grade HS Math Assessment Proficiency vs. Alternate Assessment Proficiency Rates for Students with Disabilities FFY 2020 Data 13.21% 1.92% 29.63% FFY 2021 Data 40.55% 7.42% 26.34% Grade Grade 4 Grade 8 Grade HS FFY 2021 Target 13.62% 2.33% 30.04% Investing for tomorrow, delivering today. 33
Statewide Assessment (Indicator 3) Proficiency rate for children with IEPs scoring at or above proficient against grade level academic achievement standards for the 2020-2021 school year - Proficiency rate for all students scoring at or above proficient against grade level academic achievement standards for the 2020-2021 school year D. Gap in proficiency rates for children with IEPs and all students against grade level academic achievement standards. New indicator in FFY2020 Investing for tomorrow, delivering today. 34
State Assessment Proficiency Achievement Gap SWDs vs. All Students(Indicator 3D) Reading Assessment Proficiency Rates for Students with Disabilities vs. All Students Group Name Grade 4 Grade 8 Grade HS FFY 2020 Data 39.82 31.27 39.45 FFY 2021 Target 39.42 31.27 39.45 FFY 2021 Data 27.02 26.27 26.79 Math Assessment Proficiency Rates for Students with Disabilities vs. All Students Group Name Grade 4 FFY 2020 Data 11.15 FFY 2021 Target 11.15 FFY 2021 Data 18.29 Grade 8 10.07 10.07 17.01 Grade HS 28.86 28.86 13.81 Investing for tomorrow, delivering today. 35
SPP/APR Indicator 3 Considerations Other guiding questions: What do you see? What are your initial thoughts and reactions? Is this what you expected to see? If so, how? If not, why not? What surprises you? Are there particular data that catch your attention (e.g., a certain survey question, student score)? What do these data not tell you? What are the limitations of these data? What do you and other stakeholders need to keep in mind about the data as you review them? Investing for tomorrow, delivering today. 36
SPP/APR Indicator 5 Learning Environments Percent of children with IEPs aged 5 who are enrolled in kindergarten and aged 6 through 21 served: A. Inside the regular class 80% or more of the day; B. Inside the regular class less than 40% of the day; and C. In separate schools, residential facilities, or homebound/hospital placements. (20 U.S.C. 1416(a)(3)(A)) OSEP changed the requirement to include students with disabilities in Kindergarten in these categories and indicator calculation. Investing for tomorrow, delivering today. 37
Learning Environments Ages 5 to 21 (Indicator 5) C. In separate schools, residential facilities, or homebound/hospital placements. Formula: B. Inside the regular class less than 40% of the day; and Formula: A. Inside the regular class 80% or more of the day Formula: # of children with IEPs aged 5 who are enrolled in kindergarten and aged 6 through 21 served inside the regular class less than 40% of the day # of children with IEPs aged 5 who are enrolled in kindergarten and aged 6 through 21 served in separate schools, residential homebound/hospital placements # of children with IEPs aged 5 who are enrolled in kindergarten and aged 6 through 21 served inside the regular class 80% or more of the day facilities, or total # of students aged 5 who are enrolled in kindergarten and aged 6 through 21 with IEPs total # of students aged 5 who are enrolled in kindergarten and aged 6 through 21 with IEPs total # of students aged 5 who are enrolled in kindergarten and aged 6 through 21 with IEPs Investing for tomorrow, delivering today. 38
Indicator 5A 80% of Day 54.00% 53.00% 53.00% 53.00% 53.00% 53.00% 52.51% 52.43% 51.68% 52.00% 51.53% 51.38% 51.00% 49.93% 49.82% 50.00% 48.95% 49.00% 48.00% 47.00% 46.00% 2016 2017 2018 2019 2020 2021 Data Target Investing for tomorrow, delivering today. 39
Indicator 5B Less than 40% of Day 19.00% 18.62% 18.14% 18.00% 18.50% 18.00% 18.00% 18.00% 18.00% 17.66% 17.50% 17.10% 17.00% 16.59% 16.50% 16.08% 16.42% 16.00% 16.03% 15.50% 15.00% 14.50% 2016 2017 2018 2019 2020 2021 Data Target Investing for tomorrow, delivering today. 40
Indicator 5C Separate schools, residential facilities, or homebound/hospital placements 1.00% 0.91% 0.91% 0.91% 0.91% 0.87% 0.85% 0.90% 0.79% 0.74% 0.80% 0.68% 0.70% 0.60% 0.50% 0.39% 0.39% 0.38% 0.40% 0.30% 0.20% 0.10% 0.00% 2016 2017 2018 2019 2020 2021 Data Target Investing for tomorrow, delivering today. 41
SPP/APR Indicator 5 Considerations Other guiding questions: What do you see? What are your initial thoughts and reactions? Is this what you expected to see? If so, how? If not, why not? What surprises you? Are there particular data that catch your attention (e.g., a certain survey question, student score)? What do these data not tell you? What are the limitations of these data? What do you and other stakeholders need to keep in mind about the data as you review them? Investing for tomorrow, delivering today. 42
SPP/APR INDICATORS: 6 PRESCHOOL LEARNING ENVIRONMENT 7- PRESCHOOL OUTCOMES
SPP/APR Indicator 6 Preschool Learning Environments Percent of children with IEPs aged 3, 4, and aged 5 who are enrolled in a preschool program attending a: A. Regular early childhood program and receiving the majority of special education and related services in the regular early childhood program; and B. Separate special education class, separate school or residential facility. C. Receiving special education and related services in the home. (20 U.S.C. 1416(a)(3)(A)) OSEP changed the requirement to exclude students with disabilities in Kindergarten in these categories and indicator calculation. Indicator 6C is a new indicator added in FFY2020 Investing for tomorrow, delivering today. 44
Preschool Learning Environments Ages 3 to 5 (Indicator 6) A. Regular early childhood program and receiving the majority of special education and related services in the regular early childhood program; and Formula: Formula: B. Separate special education class, separate school or residential facility. C. Receiving special education and related services in the home. Formula: # of children ages 3, 4, and 5 with IEPs attending a regular early childhood program and receiving the majority of special education and related services in the regular early childhood program # of children ages 3, 4, and 5 with IEPs attending a separate special education class, separate school or residential facility) # of children ages 3, 4, and 5 with IEPs receiving special education and related services in the home total # of children ages 3, 4, and 5 with IEPs total # of children ages 3, 4, and 5 with IEPs total # of children ages 3, 4, and 5 with IEPs Investing for tomorrow, delivering today. 45
Indicator 6A Regular Early Childhood Classroom (RECC) and Receiving Majority Services in RECC 60.00% 52.08%53.38%51.71% 50.00% 50.00%52.00% 52.00% 52.00% 52.00% 44.12%46.13% 50.00% 44.90%43.86% 52.58% 53.08% 41.57% 40.00% 30.00% 20.00% 10.00% 0.00% 2014 2015 2016 2017 2018 2019 2020 2021 Data Target 46 Investing for tomorrow, delivering today.
Indicator 6B Separate Special Education Class/School 50.00% 43.75% 42.26% 45.00% 41.73% 40.49% 40.00% 32.83% 32.33% 31.83% 35.00% 30.19% 30.00% 29.18% 28.00% 30.00% 26.00% 26.00% 26.00% 25.52% 25.00% 26.00% 20.00% 15.00% 10.00% 5.00% 0.00% 2014 2015 2016 2017 2018 2019 2020 2021 Data Target 47 Investing for tomorrow, delivering today.
Indicator 6C Indicator 6C 30.00% 24.50% 24.00% 25.00% 23.00% 21.50% 19.50% 20.00% 17.00% 15.00% 10.00% 5.00% 0.41% 0% 0.00% 2020 2021 2022 2023 2024 2025 Targets Rates Investing for tomorrow, delivering today. 48
SPP/APR Indicator 6 Considerations Other guiding questions: What do you see? What are your initial thoughts and reactions? Is this what you expected to see? If so, how? If not, why not? What surprises you? Are there particular data that catch your attention (e.g., a certain survey question, student score)? What do these data not tell you? What are the limitations of these data? What do you and other stakeholders need to keep in mind about the data as you review them? Investing for tomorrow, delivering today. 49
Preschool Outcomes (Indicator 7) Percent of preschool children aged 3 through 5 with IEPs who demonstrate improved: A. Positive social-emotional skills (including social relationships); 1. Of those children who entered or exited the program below age expectations in Outcome A, the percent who substantially increased their rate of growth by the time they turned 6 years of age or exited the program. 2. The percent of preschool children who were functioning within age expectations in Outcome A by the time they turned 6 years of age or exited the program. B. Acquisition and use of knowledge and skills (including early language/ communication and early literacy); and 1. Of those children who entered or exited the program below age expectations in Outcome B, the percent who substantially increased their rate of growth by the time they turned 6 years of age or exited the program. 2. The percent of preschool children who were functioning within age expectations in Outcome B by the time they turned 6 years of age or exited the program. C. Use of appropriate behaviors to meet their needs. 1. Of those children who entered or exited the program below age expectations in Outcome C, the percent who substantially increased their rate of growth by the time they turned 6 years of age or exited the program. 2. The percent of preschool children who were functioning within age expectations in Outcome C by the time they turned 6 years of age or exited the program. Investing for tomorrow, delivering today. 50


")


")


")


")

")


")