
95% Confidence Intervals in Statistics
Confidence intervals are a key concept in statistics that provide a range within which the true value of an estimate is likely to fall. This video series explores the interpretation of 95% CIs, compares them to standard error and standard deviation, and explains how sample size and standard deviatio
5 views • 8 slides
Prism Terminology and Light Deviation
Prisms are optical devices that deviate light without changing its vergence. This module explores the various terminology associated with prisms, including Apex, Base, Refracting Angle, and Angle of Deviation. The passage of light through a prism follows Snell's Law, where the ray is deviated toward
8 views • 42 slides
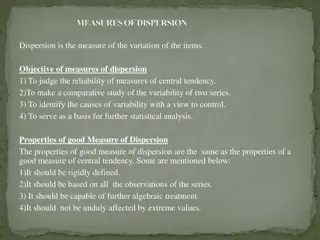
Measures of Dispersion in Statistics
Measures of dispersion in statistics help in understanding the variability of data points. They are essential for assessing the reliability of central tendency measures, comparing data sets, identifying variability causes, and guiding further statistical analysis. The properties of a good measure of
4 views • 8 slides

Effective Protocol Deviation Management in Clinical Research
Understand the importance of handling protocol deviations in clinical trials to ensure patient safety, data integrity, and compliance with regulatory requirements. Explore SOPs, electronic systems, and best practices for managing deviations effectively. Learn about GCP requirements, DMC usefulness,
3 views • 22 slides
Standard Deviation, Variance, and Z-Scores
Explore the importance of variation in interpreting data distributions, learn how to calculate standard deviation, understand z-scores, and become familiar with Greek letters for mean and standard deviation. Discover the significance of standard deviation in statistical analysis and the difference b
3 views • 18 slides
The Standard Normal Distribution in Statistics
Exploring the significance of normal distributions in statistics, this lesson covers the 68-95-99.7 rule, using Table A to find probabilities and z-scores, properties of normal curves, and the standard normal distribution. Key concepts include the mean, standard deviation, and how to standardize var
10 views • 9 slides

Measures of Variability: Variance and Standard Deviation
This lesson covers the concepts of variance and standard deviation as measures of variability in a data set. It explains how deviations from the mean are used to calculate variance, and how standard deviation, as the square root of variance, measures the average distance from the mean. Degree of fre
7 views • 26 slides
Standard Deviation in National 5 Mathematics
Standard deviation measures the spread of data around the mean, indicating how close or far apart values are from the average. This concept is crucial in analyzing data variability and consistency, with lower values signifying data clustered around the mean and higher values indicating greater dispe
7 views • 12 slides

Descriptive Statistics: Mean, Standard Deviation, and Variance
Explore the fundamentals of descriptive statistics focusing on mean, standard deviation, and variance. Dive into the importance of these measures in interpreting data patterns effectively, with practical examples like analyzing the average height of individuals and understanding central tendency met
4 views • 23 slides

Calculating Mean and Standard Deviation of Data Sets
Learn how to find the mean and standard deviation of a set of numbers using a calculator. Follow step-by-step instructions with accompanying images to understand the process. Additionally, an example is provided to calculate the mean and standard deviation of monthly salaries based on a frequency ta
4 views • 13 slides
Statistics: Understanding Variance and Standard Deviation
Understand the concepts of population variance, sample variance, and standard deviation. Learn how to calculate these measures for sample and grouped data, and their significance in analyzing data dispersion. Discover the differences between population and sample variance, and when to use each measu
7 views • 11 slides
The Significance of Deviation in Literature
Linguistic deviation in literature serves to disrupt the normal processes of communication, challenging readers with non-traditional expressions and interpretations. Writers use deviation to create unique aesthetic value in their works, prompting readers to delve deeper into unfamiliar compositions
3 views • 12 slides
Estimating Population Standard Deviation or Variance in Health Administration Programs
Overview of estimating population standard deviation or variance in health administration programs, including key concepts like point estimates and confidence intervals. Explains critical values of chi-square distribution and provides examples for better understanding.
2 views • 24 slides

Standard Deviation in AP Biology
Standard deviation is a crucial concept in biology that helps analyze variability and distribution of data. This summary provides insights into within-group and between-group variations, normal distribution, and steps to calculate standard deviation using examples and formulas.
1 views • 18 slides

Standard Deviation and Standard Error of the Means
Standard deviation measures the variability or spread of measurements in a data set, while standard error of the means quantifies the precision of the mean of a set of means from replicated experiments. Variability is indicated by the range of data values, with low standard deviation corresponding t
6 views • 7 slides
Learning Dot Plots and Mean Absolute Deviation
In this lesson, students will explore dot plots and measure variation with mean absolute deviation. They will learn to calculate the mean arm span length using a set of data and understand the characteristics impacting the mean absolute deviation. Essential questions guide the learning process, rein
3 views • 103 slides
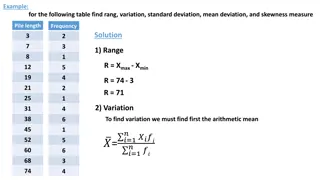
Statistical Analysis on Pile Length Data
Calculating range, variation, standard deviation, mean deviation, and skewness measure from a table showing pile lengths and frequencies. The process involves finding the range, variation, mean, mean deviation, and skewness using mathematical formulas. The step-by-step analysis includes determining
2 views • 6 slides

Supplier Deviation Process in Quality Management
The Supplier Deviation Process involves identifying and communicating temporary changes in products or processes to ensure compliance with standards. This process is crucial for maintaining product quality, minimizing risks, and preventing potential recall events. Learn when to use or not use a Supp
3 views • 14 slides
Statistics: Mode, Median, Average, Standard Deviation & Frequency Tables
Learn the basics of statistics including calculating mode, median, average, standard deviation, and creating frequency tables with practical examples and analysis methodology. Explore the concepts of central tendency and data distribution in detail.
2 views • 7 slides
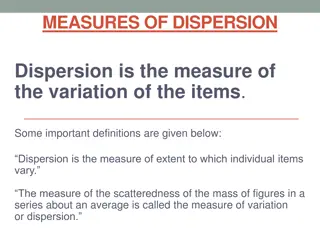
Essential Measures of Dispersion in Biostatistics
Learn about the importance of dispersion in analyzing data variability, explore ideal properties of dispersion measures, and understand commonly used measures like Range, Mean Deviation, Standard Deviation, Variance, Standard Error, and Coefficient of Variation. Discover how to compute range for ind
1 views • 24 slides
Descriptive Statistics: Mean, Median, Mode, Variance, and Standard Deviation
Learn how to calculate mean, median, mode, variance, and standard deviation using a sample data set of dog heights. Explore the concept of range and understand the significance of each statistical measure in data analysis.
6 views • 16 slides
Hypothesis Testing Procedures and Cases: Understanding Mean and Standard Deviation
Explore hypothesis testing procedures including p-value and critical-value approaches, different cases based on known standard deviation, and how to calculate z-values for sample means. Understand when to reject null hypothesis based on p-values in various scenarios.
2 views • 16 slides
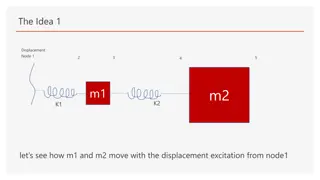
Correcting Movement Deviation in Mechanical System Analysis
Explore the comparison between results from a pure Lumped Mechanical System and Multibody Dynamics analysis, identifying reasons for deviation in movement of components m1 and m2. Discover why the LMS and MBD methods may not align in certain scenarios, offering insights into enhancing model accuracy
2 views • 5 slides
Measures of Dispersion in Statistics
Learn about the importance of dispersion in statistics and explore different measures such as range, interquartile range, mean deviation, and standard deviation. Discover how to calculate mean deviation from mean with practical examples.
3 views • 12 slides
Animal Genetics & Breeding: Measures of Dispersion and Significance
Measures of dispersion, such as variance and standard deviation, are crucial in analyzing data variability in animal genetics and breeding. Understanding the significance of dispersion helps in assessing data reliability, comparison, control, and statistical analysis. Various methods like range, qua
3 views • 46 slides
Discrete Random Variables and Their Analysis
Learn how to analyze discrete random variables in statistics, including creating histograms, calculating mean and standard deviation, and interpreting probability distributions. Explore the concept of Apgar scores for newborns and how to calculate the expected value of a random variable. Discover th
0 views • 7 slides
Abnormality Through Statistical Deviation
Explore how deviation from statistical norms is used to define abnormality, especially in deciding the need for diagnosis. Discover the strengths and limitations of this approach in assessing traits like intelligence, aggression, and empathy.
0 views • 5 slides
Mathematics Standard: Changes and Implementations
Explore the updates in the Mathematics Standard curriculum, including new course implementations and pathways. Learn about the transition from Mathematics General to Mathematics Standard, along with adjustments in content distribution and requirements for Year 11 and Year 12. Discover the flexibilit
0 views • 38 slides

Absolute Measure of Dispersion: Mean Deviation Calculation Explained
Discover the concept of mean deviation as an absolute measure of dispersion in statistics. Learn how to calculate mean deviation and its coefficient from mean in individual, discrete, and continuous series, along with visual aids for better understanding.
2 views • 6 slides

Energy Storage Resources: Base Point Deviation Charges Overview
Explore the proposal for a new Base Point Deviation (BPD) settlement system for Energy Storage Resources (ESRs) incorporating tiered deviation tolerances. Learn about the single model ESR registration, SCED base point handling, telemetering, and settlement intervals. Discover the tiered deviation to
2 views • 6 slides

Energy Storage Base Point Deviation Charges Overview
Learn about the new methodology introduced by NPRR963 for calculating Energy Storage Resource Energy Deployment Performance and Base Point Deviation for Generation and Controllable Load Resources in the context of energy storage resources. Discover how the proposed Base Point Deviation Settlement an
2 views • 23 slides

Gases: Fugacity and Activity in Standard States
The concept of fugacity and activity in standard states for real gases is explained, along with the relationship between pressure, concentration, and ideal behavior. The use of activity coefficients and standard state definitions is explored to understand the deviation from ideal gas behavior. The s
0 views • 30 slides

Understanding Measures of Variability in Data Analysis
Learn about measures of variability, such as range and standard deviation, which help analyze dispersion and variation in data sets. Explore how to calculate standard deviation from both individual and grouped data, with practical examples included.
0 views • 12 slides
Understanding Normal Distribution in Statistics
Explore the fascinating world of normal distribution, its origins from the binomial distribution, mean and standard deviation calculation, and visual representations through density functions. Learn how to manipulate the mean and standard deviation to observe shifts in the distribution curve.
0 views • 14 slides
Probability Calculations and Mileage Guarantee Exercise
Practice solving probability and normal distribution problems related to IQ test scores and tire mileage guarantees. Calculate the probabilities of scoring less than 90, between 90 and 110, and between 82.5 and 90 on an IQ test with a mean of 100 and standard deviation of 10. Determine the minimum g
2 views • 5 slides

Energy Storage Resource Base Point Deviation Charges Overview
Explore the concept of base point deviation charges for energy storage resources, including examples of over and under performance scenarios with settlement intervals and calculations for deviation amounts. Learn about creating new settlement models and optimizing response to grid requests.
4 views • 8 slides

Understanding Hypothesis Tests About the Mean with Known Standard Deviation
Learn about hypothesis testing procedures, cases, and calculations when the population standard deviation is known. Explore the p-value and critical-value approaches, different cases based on sample size and distribution, and how to calculate the z value for x bar. Master the concepts through clear
1 views • 17 slides
Understanding Variance and Standard Deviation in Probability
Explore the concept of variance as a measure of dispersion in statistics, illustrated through simple examples. Dive into the relationship between variance, standard deviation, and the interpretation of average distance from the mean. Discover how to calculate variance and explore the differences bet
3 views • 20 slides

Mastering Standard Deviation for Geography Studies
Navigate the complexities of standard deviation in geography with confidence. Take your time, watch informative videos, and enhance your understanding through practical applications. Remember, perseverance is key to success in grasping this challenging concept.
0 views • 5 slides
Understanding Variance and Standard Deviation
Learn how to understand and calculate variance and standard deviation. Variance measures the spread of data by considering all values in a set, while standard deviation shows the amount of variation from the mean. Explore the formulas and step-by-step examples to grasp these statistical concepts eff
1 views • 17 slides