Analyzing Enrollment Trends Using Markov Chain Model

This presentation explores the use of Markov chain modeling to predict enrollment trends in an educational institution. The methodology, projections, and comparisons of projected versus actual enrollments are discussed in detail, highlighting the accuracy of the model and decision criteria. Insights into the impact of the Tennessee Promise program on student populations are also provided.

Download Presentation

Please find below an Image/Link to download the presentation.
The content on the website is provided AS IS for your information and personal use only. It may not be sold, licensed, or shared on other websites without obtaining consent from the author.If you encounter any issues during the download, it is possible that the publisher has removed the file from their server.
You are allowed to download the files provided on this website for personal or commercial use, subject to the condition that they are used lawfully. All files are the property of their respective owners.
The content on the website is provided AS IS for your information and personal use only. It may not be sold, licensed, or shared on other websites without obtaining consent from the author.
E N D
Presentation Transcript
Fall 2014 Enrollment Fall 2015 Projections Mike Hoff Institutional Research & Effectiveness 9.25.14
Outline Recap Fall 2014 Projections Provide Fall 2015 Projections Tennessee Promise Populations Impacted by Promise Populations Not Impacted by Promise Discuss Potential Response To Promise
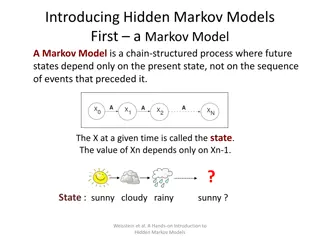
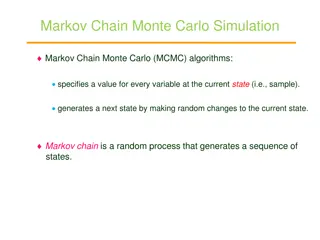
The Model Markov Chain
Markov Chain Is a time-series model that looks at past practice to predict future outcome For enrollment modeling, Markov chain tracks students, by status, from year1to year2 allowing the researcher to calculate an recruitment rate and dropout rate by class The recruitment and retention rates are applied to the current standing of year2to students, adding in new inputs by class for year2, to calculate enrollment for year3
Markov Chain - Continued Markov chain was chosen because It is used by other similar institutions, both in-state, and out-of-state It uses only institutional data Studies have shown it is accurate for 1 year projections Population based models were rejected due to reliance on external projections ARIMA and other SAS projections were rejected because of complexity without increased accuracy
2014 Projection vs Actual Year Projection Actual Difference % Difference 2010 14,860 14,952 -92 -0.619% 2011 15,188 15,250 -62 -0.408% 2012 15,428 15,133 295 1.912% 2013 14,967 14,691 276 1.844% 2014 14,430 14,433 -3 -.0003%
2014 Projection vs Actual The model was 99.99% accurate This does not mean we didn t influence enrollment at ETSU this past year This just means that all things being equal we performed as the model would expect
University Credits by Level 2010-2014 Year Total 1,xxx 2,xxx 3,xxx 4,xxx Graduate 2010 178,851 55,253 45,124 30,539 25,153 17,886 2011 182,281 56,596 46,650 30,966 26,348 17,188 2012 177,819 54,762 46,826 31,159 26,854 18,218 2013 171,366 51,561 44,227 30,398 26,356 18,824 2014 169,716 52,384 43,705 29,736 25,280 18,611 % Change -5.11% -5.19% -3.14% -2.63% 0.50% 4.05%
Total Credits Fall 2010 -2014 College 2010 2011 2012 2013 2014 % Change UNIV 178,851 182,281 177,819 171,366 169,716 -5.11% AS 98,490 100,103 95,909 90,041 88,094 -10.56% BT 29,870 29,676 29,554 28,950 29,267 -2.02% CR 7,138 7,473 7,930 8,141 8,155 14.25% CS 1,309 1,499 643 685 540 -58.75% ED 19,877 20,067 20,468 20,692 19,418 -2.31% NU 9,623 10,518 10,876 11,407 11,890 23.56% PU 9,140 9,835 10,218 9,890 10,012 9.54%
Fall 2015 Projection Year Projection Actual Difference % Difference 2011 15,188 15,250 -62 -0.408% 2012 15,428 15,133 295 1.912% 2013 14,967 14,691 276 1.844% 2014 14,430 14,433 -3 -.0003% 2015 14,297 2% NA NA NA
Fall 2015 Projection UG/GR enrollment 13,685 1% drop from Fall 2014 MED enrollment projected at 288 Pharm enrollment projected at 324 Total Projection 14,297
Fall 2015 Projection This model assumes we do everything the same and the external environment remains stable Two things we know: The external environment will not remain stable We will improve
Fall 2014 Growth Goals Recruitment Increase Retention Increase College Total Increase AS 154 220 374 BT 84 121 205 CR 35 50 85 CS 17 25 42 ED 75 107 182 NU 57 82 139 PU 18 25 43 Total 440 630 1,070
Fall 2014 Growth Outcomes College Goal Actual Growth FA13-FA14 AS 374 -152 BT 205 47 CR 85 23 CS 42 -10 ED 182 -91 NU 139 55 PU 43 79 Total 1,070 -49
Fall 2015 Enrollment Goal The primary objective is to maintain Fall 2014 actual enrollments, thus compensating for any impact of Tennessee Promise Also, to continue the pursuit of the growth agenda metrics that have been identified to represent a stretch goal of 15,000
Fall 2015 Enrollment Goals Fall 2015 College Enrollment Goals FA2014 Enrollment FA2015 Projected Resulting Enrollment Increase Goal 15,000 Resulting Enrollment College Increase Goal Flat AS 4,195 4,068 77 4,145 173 4,241 BT 2,479 2,480 46 2,526 104 2,584 CR 964 964 18 982 40 1,004 CS 415 416 8 424 17 433 ED 2,045 2,045 38 2,083 87 2,132 NU 1,787 1,786 33 1,819 75 1,861 PU 609 609 13 622 29 638 Other 1,328 1,198 23 1,221 53 1,251 Total 13,822 13,566 256 13,822 578 14,144
Submit Growth Plans That Plans: Must outline plan for both flat enrollment and growing to 15,000 students Must be college specific Must be transparent in depicting college engagement for bona fide improvement tactics Will be assessed using the overall enrollment goals presented Each plan must clearly and convincingly make the case for achieving a defined percentage of the college recruitment and retention goals Must include both recruitment and retention initiatives Will be used to evaluate, by college, positions requested pending available funds Should depict college assessment of risk
Dont Limit Your Plan Consider Pedagogy & Delivery Systems Curriculum Bridge Courses New Markets (International & Domestic) New Collaborations Alternative Schedules & Calendars New Partnerships New Student Populations With distinctive career goals Students who cannot come to main campus (ex. E-Learning, International, Out-of-state, etc.) Trade impacted workers Service to others
What is Tennessee Promise? Last dollar grant to cover all tuition at TN community colleges, TCAT s or 4-year institutions offering an Associate Degree Available to all TN high school graduates beginning with class of 2015 No GPA or ACT/SAT requirements to qualify Includes mentoring Program
Requirements/Deadlines Apply for Tennessee Promise by November 1 Submit FAFSA by February 15 Attend first mandatory meeting coordinated by partnering organization March 1 Attend second mandatory meeting coordinated by partnering organization May 31 Complete first 8 hours of community service August 1
POPULATION IMPACTED BY PROMISE
ETSU First-Time Freshmen Total First-Time Freshmen Population 2,001 Population Impacted by Tennessee Promise Total Tennessee First-Time Freshmen Fall 2014 1,694 (85% of Total First-Time Freshmen) Target group has an ACT between 18-24 887 Fall 2014
Projected Impact Scenario State Guidance Worst Case Impact 7% Decline* All ACT 18-24 Current Total 1,694 1,694 Projected Loss 119 887 Resulting Enrollment 1,575 807 *Based on the November 1st Registration Deadline
POPULATION NOT IMPACTED BY PROMISE
Populations Not Impacted Border County Regional Enrollment Out-of-State E-Rate Veterans Transfer Students International Students Graduate Students Retained Students
Border County Enrollment 1100 R = 0.7363 1000 900 800 700 600 500 400 Fall 2009 765 Fall 2010 834 Fall 2011 870 Fall 2012 884 Fall 2013 990 Fall 2014 871 Border County
Regional County Enrollment 300 R = 0.4203 250 200 150 100 50 0 Fall 2009 234 Fall 2010 227 Fall 2011 208 Fall 2012 255 Fall 2013 269 Regional Counties
Out-of-State Enrollment (Not Border) 1150 R = 0.4407 1100 1050 1000 950 900 850 Fall 2009 959 Fall 2010 1014 Fall 2011 975 Fall 2012 1095 Fall 2013 980 Fall 2014 1133 Out-of-State
E-Rate 250 R = 0.9657 200 150 100 50 0 Fall 2010 13 Fall 2011 40 Fall 2012 131 Fall 2013 170 Fall 2014 205 E-Rate
Veteran Enrollment 600 R = 0.9047 500 400 300 200 100 0 Fall 2010 444 Fall 2011 457 Fall 2012 483 Fall 2013 491 Fall 2014 548 Veteran Enrollment
Transfer Student HC 1300 R = 0.8727 1250 1200 1150 1100 1050 1000 950 Fall 2009 Fall 2010 Fall 2011 Fall 2012 Fall 2013 Fall 2014 1173 1111 1253 Transfer Student HC 1189 1132 1057
One Year Retention and Graduation 100 90 80.5 79.7 78.9 78.3 74.5 74.3 74.1 73.7 80 70 60 Transfer 50 All Other 40 30 20 10 0 Fall 2009 Fall 2010 Fall 2011 Fall 2012
International 600 500 400 300 200 100 0 Fall 2009 292 Fall 2010 320 Fall 2011 321 Fall 2012 396 Fall 2013 473 Fall 2014 488 International
Graduate 5000 4333 4500 3912 3773 4000 3669 3639 3468 3500 3000 2271 2222 2260 2269 2207 2123 HC 2500 Applications 2000 1500 1000 500 0 Fall 2009 Fall 2010 Fall 2011 Fall 2012 Fall 2013 Fall 2014
Retained Students Improving retention is imperative to growing enrollment, and graduation From Fall 2013 to Fall 2014 we lost 430 students with no financial hold and a GPA of 3.0 or higher Finding away to keep even half of these students could be enough to manage the potential impact of Tennessee Promise
Current Initiatives To Mitigate TN Promise Improve Advising Hiring 14 Professional Advisors Expanding use of the EAB Student Success Collaborative Restructure Scholarships Presentation by Kathy Feagins
Closing Thoughts Fall 2015 Enrollment Projected between 14,178 and 14,583 Just to maintain the level of enrollment achieved in Fall 2014 is going to require purposeful and effective recruitment and retention efforts Our response to Tennessee Promise is two- pronged Limit the loss of Tennessee First-Time Freshmen Grow Populations not impacted by Tennessee Promise


")