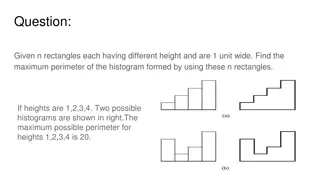
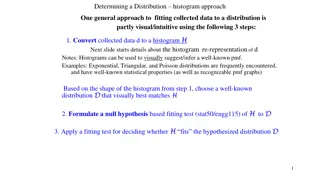
Explore various graphical displays such as dot plots, histograms, and box plots to analyze distributions of data in statistics. Learn key concepts like measures of center, spread, and position, and interpret shapes and patterns in data sets. Gain insights into common statistical tools and techniques for data analysis.
Please find below an Image/Link to download the presentation.
The content on the website is provided AS IS for your information and personal use only. It may not be sold, licensed, or shared on other websites without obtaining consent from the author. If you encounter any issues during the download, it is possible that the publisher has removed the file from their server.
You are allowed to download the files provided on this website for personal or commercial use, subject to the condition that they are used lawfully. All files are the property of their respective owners.
The content on the website is provided AS IS for your information and personal use only. It may not be sold, licensed, or shared on other websites without obtaining consent from the author.
E N D
Presentation Transcript
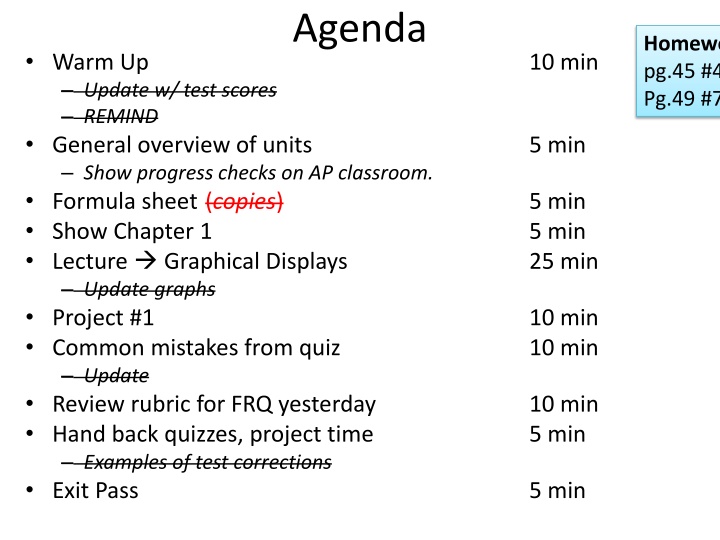
Agenda Homework (AP) pg.45 #49 Pg.49 #70 Warm Up Update w/ test scores REMIND General overview of units Show progress checks on AP classroom. Formula sheet (copies) Show Chapter 1 Lecture Graphical Displays Update graphs Project #1 Common mistakes from quiz Update Review rubric for FRQ yesterday Hand back quizzes, project time Examples of test corrections Exit Pass 10 min 5 min 5 min 5 min 25 min 10 min 10 min 10 min 5 min 5 min
Sign up for our Remind: Text to 81010, message: @602ap2020 n Mean Median Warm Up 30 86.37% 88.89% Comment on the distribution of your scores on last Friday s mini-quiz.
A typical unit (5-8 days) Days Content 2-4 Lecture, notes, examples, practice 1-2 Activities (Grudgeball, Unscramble, Investigation, Gauntlet, Stations, etc.) 1 Practice test + AP classroom 1 Test On 1st day of unit, you get: Practice test All multiple-choice (MC) questions and free-response questions (FRQ) on AP classroom. Usually 2 sets of ~14-18 MC, and 2 FRQ's. Both are due test day. AP classroom more questions, easier, good for catching blind spots Practice test good "content" practice, ~same difficulty as test, use for depth not breadth. I recommend AP classroom ongoing. On day before test, focus on practice test and any tough remaining AP-classroom questions.
Formula Sheet 3 pages, double-sided Everything you get on the AP exam Use always, on everything(checkups, homework, tests ) No writing on it. Return to me at end of course.
Chapter 1 Summary Graphical displays of a distribution of values Dotplot, stemplot, histogram, boxplot, cumulative frequency plot Numerical summaries of a distribution of values Measures of center Median, mean Measures of spread Range, interquartile range, standard deviation Measures of position Quartiles, percentiles From a graphical or numerical summary, comment on the . Shape Symmetric vs. skewed, bimodal, uniform, clusters, gaps, approximately normal Center Median, mean Spread
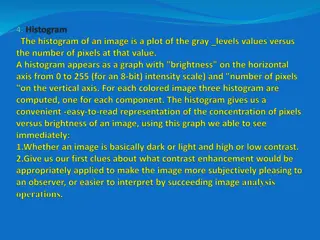
1 of 3 Notes 29 32 32 34 34 34 35 35 35 35 36 36 36 36 37 Histogram Similar to bar graph, but quantitative, and bars (usually) touch Good for larger data sets Break values into classes Break up range (max-min), use judgment on # Display count ( frequency ) in each class 38 38 38 38 39 39 40 42 43 45 46 47 48 48 49 Example, Geogebra
2 of 3 Notes Pie chart Categorical Warnings: Must include all categories And (next slide) Abortion = legal? NO, 10 YES, 18
3 of 3 Notes 29 32 32 34 34 34 35 35 35 35 36 36 36 36 37 Stemplot ( stem-and-leaf ) Quantitative only. 1. Separate into stems (usually all but last digit) and a leaf (usually last digit) 2. Stems in vertical column, consecutive. 3. Vertical line. Each leaf matches, consecutive. 38 38 38 38 39 39 40 42 43 45 46 47 48 48 49 Show how to do Geogrebra
Fall 2019 125 125 130 132 132 135 136 140 145 152 152 Spring 2019 99 120 130 130 132 140 144 150 150 150 152 You try Guesses of my weight, this semester vs. last Spring. 155 160 160 160 160 160 160 160 167 170 175 180 156 158 163 165 166 170 170 170 175 175 190 195 Make a back-to-back stemplot of both.
AP Statistics exam Summary Multiple Choice Section: Worth 50% of your overall grade. 40 questions in 90 minutes, 2.25 minutes/question No penalty for an incorrect guess. Free Response Section: Worth 50% of your overall grade. 6 questions in 90 minutes (usually feels rushed) First 5 questions are shorter, 10-15 minutes each. 6th question is called the investigative task. Worth 2x other FRQ Usually takes ~30 minutes. Don t save it until the end of the exam
Test explanations (optional) Thoroughly explain why the right answer is the right answer and Thoroughly explain why your wrong answer is wrong 1. 2. GOOD: means you have to multiply the 5 into everything in the parentheses, so the x and the 7 get multiplied by 5. I just multiplied 5 into the first part of the parentheses to get my wrong answer, 5x-7. BAD: 5(x - 7) becomes 5x 35 5(x 7) becomes 5x 35 because the Distributive Property +1 point each MC, +1 point per sub-part for FRQ. Goes into Tests/Quizzes category as extra credit. Due before next test (this Friday 1/17). Separate paper, neatly written, stapled in front of test. Must be done in classroom, any time (~7:45 am to ~4:30pm)
Project #1 (AP): Exploring Quantitative Data 28 points in Projects grade Due Tuesday 1/21 Collect and use any quantitative data Sample projects by door You are responsible for reading the assignment handout, especially the rubrics.
How long is a minute? You and your partner will need 1 watch/timer. Sit as far as possible from classmates. Door Tell Window to start counting 1 minute Window When you think it s been a minute, say Stop quietly. Door Write down time in seconds Do NOT tell partner how much time passed. Do NOT erase the data until I ve collected it. Two trials, then switch roles.
Homework (AP) pg.45 #49 Pg.49 #70-75 Exit Pass 1 7 5 1. Without discussing with anyone else how much do you expect to make for your annual salary in your 1st year of full-time employment? 11 10 6 14 8 2 10 0 5 9 1 8 25 2 1 These are self-reported from my students last Spring, on the number of hours they spent studying in a typical week. Display the data as a: 2. Stem-and-leaf plot 3. Histogram


")


 Graphical Displays")


")
:")

")