Introduction to Decision Trees and Bagging Techniques
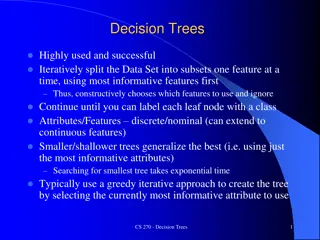
In this content, you will learn about decision trees, their construction, splits, and algorithms like CART. Explore the concepts of bagging methods, including an overview of random forest and multivariate decision trees. Dive into the fundamentals of tree bagging, boosting, and stacking for data analysis applications.

Download Presentation

Please find below an Image/Link to download the presentation.
The content on the website is provided AS IS for your information and personal use only. It may not be sold, licensed, or shared on other websites without obtaining consent from the author. If you encounter any issues during the download, it is possible that the publisher has removed the file from their server.
You are allowed to download the files provided on this website for personal or commercial use, subject to the condition that they are used lawfully. All files are the property of their respective owners.
The content on the website is provided AS IS for your information and personal use only. It may not be sold, licensed, or shared on other websites without obtaining consent from the author.
E N D
Presentation Transcript
Trees, bagging, boosting, and stacking Usman Roshan
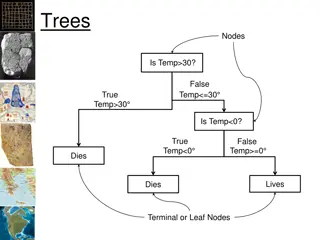
Decision tree From Alpaydin, 2010
Decision tree construction For a given dataset there are many trees with no error Finding the tree with no error and fewest nodes is NP- complete Finding split in one column Goodness of split given by entropy, gini index, or misclassification error. Binary classification: Let p be the proportion of instances in class 0. Find split that minimizes weighted sum of impurities of child nodes: Misclassification error: 1 max(p,1-p) Entropy: plog(p) (1-p)log(1-p) Gini index: 2p(1-p) Similar approach for regression (regression trees)
Decision tree splits Example: consider the simple one dimensional data shown below. Points from class 0 have label x and from class 1 have label o. x x x o o x x x Consider split 1 which is just before the first x (trivial split). Consider split 2 which is between the third x and first o. For split 1 Classification error impurity = 0 + (1)2/8 Gini impurity = 0 + (1)6/8(2/8) = 12/64 For split 2 Classification error impurity = 3/8(0) + 5/8(2/5) = 2/8 Gini impurity = 3/8(0) + 5/8(3/5)(2/5) = 6/40 Thus Gini selects the second split while for misclassification impurity there is a tie
CART algorithm - Training Recurse(data): Find column with minimum classification error If error < threshold then stop Bipartition the space with the split. Let dataneg and datapos be the set of points with negative and positive predicted labels. Recurse(dataneg) Recurse(datapos)
CART algorithm - Testing The training procedure gives us a decision tree. We classify a given dataset by testing feature values at each node Example
Bagging Randomly sample training data Determine classifier Ci on sampled data Goto step 1 and repeat m times For final classifier output the majority vote Popular example: random forest Similar to tree bagging Compute decision trees on bootstrapped datasets Return majority vote
Bootstrap The probability of picking one row out of n is 1/n. Therefore the probability of not picking it is 1- (1/n) After n trials the probability of not picking it is (1- (1/n))n As n approaches infinity (1-(1/n))n becomes e- 1=0.368. Therefore approximately 63.2% of datapoints are uniquely selected in a bootstrap
Variance reduction by voting What is the variance of the output of k classifiers? Thus we want classifiers to be independent to minimize variance Given independent binary classifiers each with accuracy > the majority vote accuracy increases as we increase the number of classifiers (Hansen and Salamon, IEEE Transactions of Pattern Analysis and Machine Intelligence, 1990)
Random forest In addition to sampling datapoints (feature vectors) we also sample features (to increase independence among classifiers) Compute many decision trees and output majority vote Can also rank features Comparison against SVM feature selection in genomic data Alternative to bagging is to select datapoints with different probabilities that change in the algorithm
Boosting Main idea: Assign equal probabilities to training data Randomly sample from training data and classify Redo probabilities by assigning lower values to correctly classified points and higher to misclassified points Go to step 2 and repeat Perform final classification with weighted combination of classifiers
Ada-boost From Alpaydin, 2010
Empirical performance 37 random UCI datasets Number of rows ranges from 99 to 7352 Number of columns ranges from 4 to 1300 Datasets include biological, medical, robotics, business, and social networks Compared optimized linear SVM program liblinear to fest Mean liblinear error: 12% Mean boosted (100) trees error: 10.2% Mean decision tree error: 14.6%