Optimizing Spatial Temporal Data Visualization
Explore the implementation of efficient spatial-temporal data visualization using R*-trees to gain insights into geographic environmental data. Learn about the motivation, proposition, problem definition, proposed techniques, and tools used in this project.

Download Presentation

Please find below an Image/Link to download the presentation.
The content on the website is provided AS IS for your information and personal use only. It may not be sold, licensed, or shared on other websites without obtaining consent from the author. If you encounter any issues during the download, it is possible that the publisher has removed the file from their server.
You are allowed to download the files provided on this website for personal or commercial use, subject to the condition that they are used lawfully. All files are the property of their respective owners.
The content on the website is provided AS IS for your information and personal use only. It may not be sold, licensed, or shared on other websites without obtaining consent from the author.
E N D
Presentation Transcript
Visualization of Spatial Visualization of Spatial- -Temporal Data Through R* Temporal Data Through R*- -Tree Tree Group #7 Kendric Hood: Team President Daniel Bevilacqua: Team King Zack Ulam: Team Prime Minister William Smith: The Fresh Prince of Big Data
Motivation Our motivation behind this project is to implement an efficient and reliable way to visualize geographic environmental data. This is useful for non-expert viewers to gain insight into data that might otherwise be inaccessible. This also always for easy and quick insight into large data sets for other fields of research[2], traffic navigation[4], etc.
Our Proposition The data will be stored and retrieved from an R*-tree, which we will store and access the data from to create a visualization. This will help for understanding the data set in the R*-tree. [1],[2] We will attempt to use a similar method to graphVizdb[5]. Our project will however differ in that we will be attempting to optimize it for spatio-temporal data, that is we will attempt to use a similar pattern to graphVizdb[5] but adapt it to better show spatio-temporal data and allow for easier understanding of the data.
Problem Definition - Code for graphVizdb unavailable online and is not built for spatio-temporal data, so we will be implementing our own version that is built for spatio-temporal data. - A large amount of sample data needs to be generated and inserted into the R* tree. That tree then needs to be preprocessed, and the subtrees indexed. - Large amounts of data may make visualization slow or hard to read.
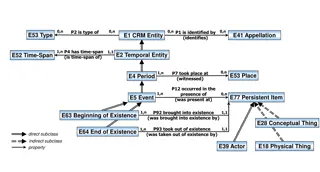
The Proposed Techniques (graphVizdb) http://83.212.97.26:8080/graphVizdb/ Figure 1.Preprocessing Overview [5]
Changes from Proposed Technique Storage Techniques - Partitioning technique - - Differences in tools - - - B+ Tree and R-Tree vs. R* Tree Partitioning data to separate tables vs. Index of subgraphs of R* Tree Both, however, operate at the k-level MySQL vs. SQLite3 Java vs. Python mxGraph vs. Google Charts
Tools Used SQLite3 - R* Tree implementation built-in - Used to store data Python, JavaScript, HTML - Python - used to code the actual program - HTML, JavaScript - used for web interfacing with visualization module Google Charts - Visualization of data
Current State Method for preprocessing data developed (Bounding box query and index) - Preprocess based on either time or location Developed graphing method (time x zip_code, color) - Height = Zip code - Width = time - Color = person identification Developed relationship model (weak/strong intersection) - Strong relationship - explicit intersection, or both people are in the same zip code at the same time - Weak relationship - implicit intersection, or the line connecting two explicit points intersects. Presents the possibility that two people were in the same place at the same time, but not guaranteed - No relationship - The no intersection between the two points Bounding View - Bounding box query based on the the view in the visualization
Future Work Expanding the dimensionality of our visualization For example, mapping coordinate (x, y) location instead of just zip This would create new set of visualization constraints and problems to solve (x,y) plotted physically as x,y coordinates of graph, then use color gradient to denote time, some other marker to denote the person s ID. Adding meaning to relationships As of right now, relationships just exist. Making relationships more meaningful can allow queries based on implicit intersections Probability
Citations [1]A. Ahmad, M. A. Rahman, B. Sadiq, S. Mohammed, S. Basalamah and M. R. Wahiddin, "Visualization of a Scale Free Network in a Smartphone-Based Multimedia Big Data Environment," 2015 IEEE International Conference on Multimedia Big Data, Beijing, 2015, pp. 286-287. URL: http://ieeexplore.ieee.org/stamp/stamp.jsp?tp=&arnumber=7153899&isnumber=7153824 [2] D. Guo and Yi Du, "A visualization platform for spatio-temporal data: A data intensive computation framework," 2015 23rd International Conference on Geoinformatics, Wuhan, 2015, pp. 1-6. URL: http://ieeexplore.ieee.org/stamp/stamp.jsp?tp=&arnumber=7378668&isnumber=7378547 [3] Xie, Yanhua, and Qihao Weng. "Spatiotemporally enhancing time-series DMSP/OLS nighttime light imagery for assessing large-scale urban dynamics." Spatiotemporally enhancing time-series DMSP/OLS nighttime light imagery for assessing large-scale urban dynamics. Center for Urban and Environmental Change, Department of Earth and Environmental Systems, Indiana State University, 30 Oct. 2016. Web. 05 Apr. 2017. [4] X. Yu, T. Zhang and Q. Jiang, "Spatio-temporal data query of urban traffic navigation considering point of interest," 2013 6th International Conference on Information Management, Innovation Management and Industrial Engineering, Xi'an, 2013, pp. 288-291. doi: 10.1109/ICIII.2013.6702931 [5] N. Bikakis, J. Liagouris, M. Krommyda, G. Papastefanatos and T. Sellis, "graphVizdb: A scalable platform for interactive large graph visualization," 2016 IEEE 32nd International Conference on Data Engineering (ICDE), Helsinki, 2016, pp. 1342-1345. doi: 10.1109/ICDE.2016.7498340 [6] Zhu, Qing, Jun Gong, and Yeting Zhang. "An efficient 3D R-tree spatial index method for virtual geographic environments." ISPRS Journal of Photogrammetry and Remote Sensing 62.3 (2007): 217-224.


")