Analyzing Trends in Progress: Positive, Negative, and Neutral Perspectives
Analyze and discuss trends in progress through graphs and conceptual frameworks to determine if they align with positive, negative, or neutral perspectives. Consider the probable futures and preferable outcomes for these trends over the next 50 years. Explore the notion of progress, optimism, and the changing dynamics of the world with a critical lens.
Analyzing Trends in Progress: Positive, Negative, and Neutral Perspectives
PowerPoint presentation about 'Analyzing Trends in Progress: Positive, Negative, and Neutral Perspectives'. This presentation describes the topic on Analyze and discuss trends in progress through graphs and conceptual frameworks to determine if they align with positive, negative, or neutral perspectives. Consider the probable futures and preferable outcomes for these trends over the next 50 years. Explore the notion of progress, optimism, and the changing dynamics of the world with a critical lens.. Download this presentation absolutely free.
Presentation Transcript
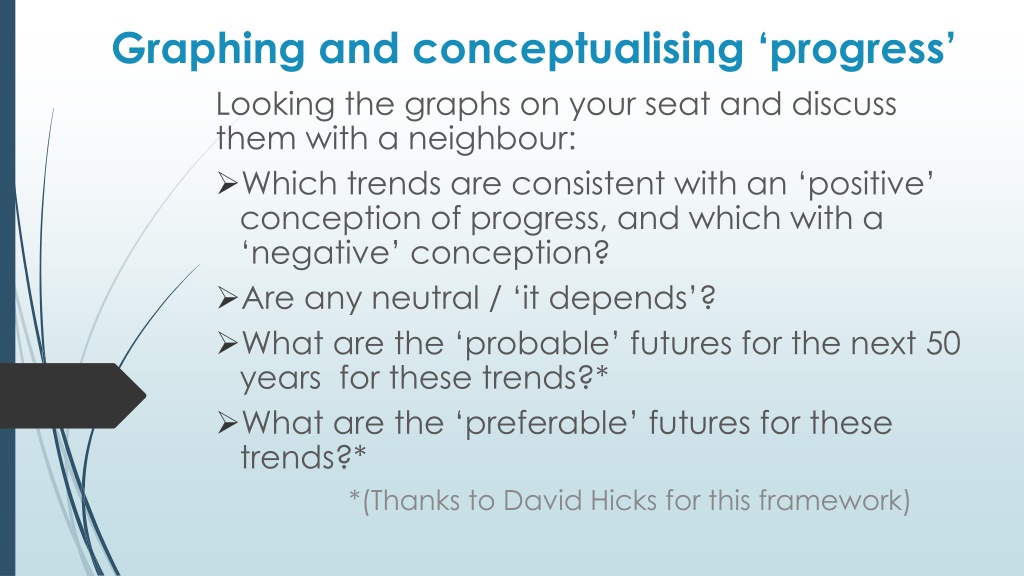
Graphing and conceptualising progress Looking the graphs on your seat and discuss them with a neighbour: Which trends are consistent with an positive conception of progress, and which with a negative conception? Are any neutral / it depends ? What are the probable futures for the next 50 years for these trends?* What are the preferable futures for these trends?* *(Thanks to David Hicks for this framework)
Our students will be more curious and more intelligently so if, in addition to facts, they were equipped with theories of ignorance as well as theories of knowledge Jamie Holmes (2015) The case for teaching ignorance New York Times, 24 Aug 2015 https://www.nytimes.com/2015/08/24/opinion/the-case-for-teaching-ignorance.html The last thing a teacher needs in an information saturated world is to give her pupils more information instead they need to be able to tell the difference between what is and is not important and to be able to combine that information into a broad picture of the world. Yuval Noah Harari, 21 Lessons for the 21stCentury (2018)
Optimism, progress and geography celebration and calibration David Alcock Geography Teacher, Bradford Grammar School @DavidAlcock1 dga@bradfordgrammar.com www.alcock.blog
Is the world getting better? Thinking generally about the world, all things considered, do you think the world is getting better or worse, or neither getting better nor worse? You choose: A: Getting better B: Neither getting better nor getting worse C: Getting worse
Share of the world population living in absolute poverty My travels: 1999-2001 Share of the world living in absolute poverty 2015 1820
Share of the world population living in absolute poverty My travels: 1999-2001 Share of the world living in absolute poverty Rosling: Bad and better 2015 1820
Is the world getting better? Thinking generally about the world, all things considered, do you think the world is getting better or worse, or neither getting better nor worse? You choose: A: Getting better B: Neither getting better nor getting worse C: Getting worse
% of each group saying that the world is getting better 45 40 35 30 25 % 20 15 10 5 0 Yr8 Yr11 Yr12 Staff
% of each group saying that the world is getting better Source: IPSOS- MORI global attitudes survey, 2016 30 25 20 15 % 10 5 0 BGS average UK USA European Av
https://ourworldindata.org/wp-content/uploads/2017/01/Two-centuries-World-as-100- people.png
In the last 20 years the proportion of people living in extreme poverty (living on less than $1.90 a day), worldwide, has ? A. Almost doubled B. Remained more or less the same C. Almost halved
In the last 20 years the proportion of people living in extreme poverty, worldwide, has ? A. Almost doubled B. Remained more or less the same C. Almost halved
In the last 20 years, the proportion of people living in extreme poverty, worldwide has almost halved. How many chose the right answer? 35 30 25 % correct 20 15 10 5 0 Yr8 Yr11 Yr12 Staff Chimp
In all low income countries across the world today, how many girls finish primary school? A. 20% B. 40% C. 60%
In all low income countries across the world today, how many girls finish primary school? A. 20% B. 40% C. 60%
In all low income countries across the world today, 60% of girls finish primary school. How many chose the right answer? 35 30 25 % correct 20 15 10 5 0 Yr8 Yr11 Yr12 Staff Chimp
There are two billion children in the world today, aged 0 to 15 years old. How many children will there be in the year 2100 according to the United Nations? A. 4 billion B. 3 billion C. 2 billion
There are two billion children in the world today, aged 0 to 15 years old. How many children will there be in the year 2100 according to the United Nations? A. 4 billion B. 3 billion C. 2 billion
There will be 2 billion children in the world in 2050. How many chose the right answer? 35 30 25 % correct 20 15 10 5 0 Yr8 Yr11 Yr12 Staff Chimp
Since 1950, the world has become more Peaceful Democratic Healthy Wealthy Well nourished Educated Connected Gender equal Tolerant
Over the past 300 years, the world has become more Peaceful Democratic Healthy Wealthy Well nourished Educated Connected Gender equal Tolerant
Reasons for misperceptions and ignorance about global progress Misperception and ignorance Heuristics (psychological biases) Peers Parents Mass media Politics: progressophobia and ritualised denunciation of government Demographics Education
The role of education in facilitating misperceptions and ignorance about the state of the world Curriculum Content Year 8: Crime, Development, Rivers (culminating in flooding) Year 9: A Risky World, Resources, Coasts (culminating in climate change)
The role of education in facilitating misperceptions and ignorance about the state of the world Textbooks/resources: Focus on challenges vs limited time and space spent looking at successes? Out-of-date information and resources Few graphs! Inaccuracies
A manifesto for how educators could deal with misperceptions about progress Inspired by Bobby Duffy, Psychologist, Kings College London
1. Things are not as bad as we think and most things are getting better Ignorance test Schemes of work on Factfulness / rules of thumb Infographics on walls Documentaries & TED talks from Gapminder website
2. Cultivate scepticism, but not cynicism Question our information Encourage our students to do so Deep interrogation of images, graphs, texts e.g. layers of inference Layers of inference framework Source: Margaret Roberts / GA
3. See things from others points of view Decision-making and issues-based exercises Dollar Street Diaries, video footage
4. Consider our use of extreme examples Context is key Graphs Proportional symbols Visualising scale Embodying scale Use of headline creators
6. Unfilter their world Devil s advocate Range of media
7. Pick up on factual errors Proof reading Referencing Spot the typo Teachable moment
8. Move beyond the usual suspects Malthus vs Boserup Simon vs Ehrlich Vogt vs Borlaug Lomborg vs most environmentalists! Rosling Steven Pinker Max Roser Matt Ridley
9. Keep your resources up to date Tough but effective
10. Stimulus material Media Quotations from doomsayers vs overoptimists
Beyond Geography Work with colleagues in the humanities and social sciences Critical thinking Thinking and Reasoning Skills IB Deliberation days
Be optimistic - dont be complacent! Climate change Extremism Cybercrime Pollution Inequality Recessions Ultra-extreme poverty Mental health Spirituality Black Swan events
Summary and discussion Some further reading: Factfulness by Hans Rosling et al (2018) www.ourworldindata.org (Max Roser et al) Enlightenment Now by Steven Pinker (2018) The Perils of Perception by Bobby Duffy (2018) @DavidAlcock1 dga@bradfordgrammar.com www.alcock.blog
Related sessions Yesterday Workshop 3 - Debbie Watson and Joyce Hallam, GA Sustainability and Citizenship Special Interest Group: Young leaders get going with global goals . Workshop 21 - Jon-Paul Davies, GA Sustainability and Citizenship Special Interest Group and Mikael Arevius, Educator at Gapminder: Let the dataset change your mindset Today Workshop: The Future is bright: a positive outlook towards global issues? Karen Haward Geography Consultant, Harris Federation Liz Smith Head of Geography and Humanities, Seaford Head School GA Sustainability and Citizenship Special Interest Group Directly after this morning s break, in Room _____
