
Product and Knowledge Graphs for Enhanced Information Retrieval
Dive into the world of product and knowledge graphs, uncovering the journey to a rich product graph, examples of knowledge graphs for songs, and the mission to provide comprehensive information on products and related knowledge. Discover use cases ranging from information provision to enhancing sear
5 views • 76 slides

Exploring Various Types of Graphs in Statistics Education
Delve into the world of data visualization with slow reveal graphs, column graphs, pictographs, dot plots, divided bar graphs, sector graphs, line graphs, and stem-and-leaf plots. Engage in observations and wonderings to enhance statistical comprehension and analytical skills.
5 views • 8 slides

Graphs: An Introduction to Data Visualization
This chapter delves into various types of graphs used in data representation, such as bar graphs, pie graphs, histograms, line graphs, and linear graphs. It explains the purpose and structure of each graph type, along with practical examples. Additionally, it covers the Cartesian system for locating
3 views • 15 slides
Scatter Plots and Correlation in Data Analysis
Scatter plots display relationships between two sets of data, while correlation describes the type of relationship. The line of best fit in a scatter plot helps in visualizing patterns. Examples illustrate positive, negative, and no correlation scenarios. Learning to interpret scatter plots aids in
9 views • 11 slides

Scatter Diagram Method for Correlation Analysis
Scatter Diagram Method is a simple and effective way to study the correlation between two variables. By plotting data points on a graph, it helps determine the degree of correlation between the variables. Perfect positive and negative correlations, as well as high and low degrees of correlation, can
1 views • 11 slides
Representation of Abstract Groups through Graphs
Explore the representation of abstract groups as automorphism groups of graphs, touching on topics such as the existence of graphs whose automorphism groups are isomorphic to given abstract groups, the cardinality of connected graphs satisfying specific properties, and questions regarding the cardin
0 views • 16 slides
Low Threshold Rank Graphs and Their Structural Properties
Explore the intriguing world of low threshold rank graphs and their structural properties, including spectral graph theory, Cheeger's inequality, and generalizations to higher eigenvalues. Learn about the concept of threshold rank, partitioning of graphs, diameter limits, and eigenvectors approximat
2 views • 22 slides

Exploring Types of Graphs for Data Representation
Different types of graphs, such as line graphs, scatter plots, histograms, box plots, bar graphs, and pie charts, offer diverse ways to represent data effectively. Understanding when to use each type based on the data being collected is essential for insightful analysis. Scatter plots are ideal for
3 views • 37 slides
Relationships Through Graphs
Learn how to analyze and relate two quantities using graphs, analyze data presented in tables and graphs, and sketch graphs representing various scenarios such as the movement of a model rocket or a playground swing. The visuals provided will help you understand how to interpret and draw graphs in d
6 views • 7 slides

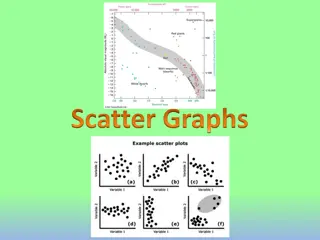
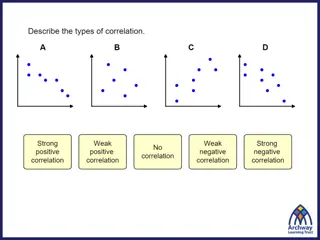
Correlation in Scatter Graphs
In this content, various graphs are used to demonstrate the concept of correlation in scatter graphs. It discusses positive, negative, and no correlation, showcasing how one variable affects the other. Examples and explanations are provided to help understand the relationships between different sets
4 views • 17 slides
Uniquely Bipancyclic Graphs by Zach Walsh
Research conducted at the University of West Georgia focused on uniquely bipancyclic graphs, defined as bipartite graphs with exactly one cycle of specific lengths determined by the order. Uniquely bipancyclic graphs have special properties, including having a Hamiltonian cycle and a specific order
3 views • 18 slides

Scatter-and-Gather Revisited: High-Performance Side-Channel-Resistant AES on GPUs
This research focuses on enhancing the security of AES encryption on GPUs by introducing the Scatter-and-Gather (SG) approach, aimed at achieving side-channel resistance and high performance. By reorganizing tables to prevent key-related information leakage, the SG approach offers a promising soluti
5 views • 34 slides
Graphs for Mathematical Interpretation
Explore how students can grasp information through graphical formats and convert it into mathematical graphs. Learn about qualitative graphs, functions, axes, and more. Delve into exercises matching graphs with situations and drawing graphs for given scenarios like plane take-off, biking, and snowbo
0 views • 16 slides
Aristotle on Plot and Tragedy: Understanding the Components and Structure
Aristotle's timeless insights on plot and tragedy delve into the constituent parts of tragedy, the structure of plot, types of plot, and the characteristics that make a plot effective. His definition emphasizes the importance of character flaws leading to the reversal of fortune in a well-crafted na
7 views • 7 slides
Plot Structure in Literature
Explore the importance of plot structure in literature through definitions, components, and engaging activities like analyzing "Little Red Riding Hood" and identifying plot elements in movies. Discover how plot shapes storytelling and connects us to profound themes about humanity and life.
1 views • 7 slides
Longhorn Cattle Genetics Through DNA Research
Longhorn cattle genetics are being investigated through DNA research to identify unique traits and differentiate them from other cattle breeds. By analyzing genetic codes with scatter plot graphs, scientists aim to map the genetic makeup of Longhorns accurately. This research helps in understanding
14 views • 9 slides
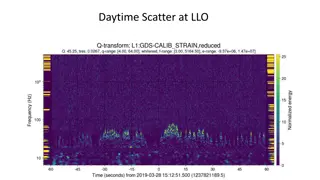
Exploration of Frequency Interactions and Correlations in High Scatter Events
Delve into the analysis of high scatter events through spectrograms and waveform comparisons of varying frequencies. Researchers investigate correlations with different signals and accelerometers, seeking to replicate and identify key patterns in the observed noise data. Ongoing efforts include exam
3 views • 7 slides
Scatter Plots and Trend Lines for Data Analysis
Scatter plots display data as ordered pairs to show relationships, while trend lines indicate correlation. Learn how to create scatter plots, interpret correlations, draw trend lines, and make predictions. Explore causation versus correlation and practice identifying causal relationships in various
3 views • 8 slides
Graphs and Their Models
Explore the world of graphs through definitions, types, and special features. Learn about vertices, edges, simple and multiple graphs, directed and undirected graphs, and more. Discover the terminology and special types of graphs along with basic concepts and properties.
9 views • 33 slides
Graphs in Mathematics and Computer Science
Graphs in mathematics and computer science are abstract data types used to represent relationships between objects. They consist of vertices connected by edges, which can be directed or undirected. Graphs find applications in various fields like electric circuits, networks, and transportation system
4 views • 19 slides
Graph Theory in Mathematics Curriculum
Integrate graphs and networks into math curriculum to engage students with practical applications. Explore simple graphs, directed graphs, bipartite graphs, matching problems, and planar graphs across different year levels. Enhance understanding of concepts like complete graphs, vertices, edges, and
5 views • 43 slides
Graphs and Trees: Understanding Relationships in Graph Theory
In the world of graph theory, graphs and trees play a significant role in describing relationships among items in a collection. Graphs consist of vertices representing intersections or stations, connected by edges like roadways or friendships. Trees, on the other hand, are minimally connected graphs
0 views • 30 slides

Aspects of Novel
A novel is a profound narrative form that reflects real-life complexities through its plot, characters, conflicts, climax, and resolution. Plot intricately weaves events, actions, and conflicts, leading to a turning point at the climax before resolving the story's conflicts. Characters drive the nar
6 views • 13 slides
Analyzing Pupils' Test Marks in Maths and Science
In this educational content, scatter graphs are used to plot pupils' test marks in Maths and Science out of 100. The data is analyzed to identify patterns and correlations between the two subjects. Students learn to plot scatter graphs, identify correlation types, and draw lines of best fit for esti
3 views • 10 slides
Scatter Diagrams for Data Interpretation
Scatter diagrams display data involving two variables, helping to identify correlations and draw lines of best fit for analysis. Learn about different types of correlations and how to estimate one variable's value given the other using scatter plots.
3 views • 11 slides

Visualizing Data in Excel: Techniques and Tools
Delve into the world of visualizing data using Excel through techniques such as interpreting graphs, creating pivot tables, using if statements, and more. Learn about different kinds of graphs like bar graphs, histograms, and scatter diagrams. Get insights on when to use scatter diagrams and how to
3 views • 27 slides
Scatter Diagrams and Correlation
Scatter diagrams and correlation help analyze the relationship between two variables, showcasing direction, linearity, and strength of correlation. Positive and negative correlations are discussed, along with how to draw scatter diagrams and identify trends by eye.
0 views • 28 slides
Introduction to Graphs and Algorithms in Data Structures
This text delves into the fundamentals of graphs and algorithms within data structures, emphasizing their role in representing relationships among items. It covers key concepts such as vertices, edges, directed and undirected graphs, standard operations, and the use of graphs to solve diverse proble
2 views • 36 slides

Intro to Graph Theory: Relationships Between Objects
Graph theory introduces a formalism for representing relationships between objects, utilizing vertices and edges in graphs. Directed graphs, undirected graphs, weighted graphs, and examples of graphs such as the internet, Facebook, highway maps, airline routes, and call graphs are discussed. The con
0 views • 4 slides
Graph Theory: Vertices, Edges, and Planar Graphs
Explore the world of graphs in graph theory, including concepts like vertices, edges, planar graphs, and Euler's theorem. Learn about dual graphs, planarity testing, and the smallest not-planar graphs K5 and K3,3. Dive into the fascinating realm of graph drawing and visualization.
2 views • 32 slides
Graph Measurements and Classifications: A Detailed Overview
Explore the world of graph measurements and classifications in this comprehensive content ranging from planar graphs to overlap graphs, power-law graphs, and small-world graphs. Discover various generators for classes of graphs and observe graphs in the wild. Learn about diverse graph statistics and
2 views • 8 slides
Types of Graphs and Data Visualization
Different types of graphs such as line graphs, scatter plots, histograms, and bar graphs to represent and analyze data effectively. Learn how to interpret correlations, variability, and statistical analysis for better data understanding.
2 views • 42 slides

Graphs and Trees: Definitions, Properties, and Representations
Explore the fundamental concepts of graphs, including vertices, edges, directed and simple graphs, complete graphs, subgraphs, Euler circuits, and more. Dive into matrix representations, planar graphs, and graph isomorphism for a comprehensive overview.
3 views • 16 slides
Exploring Graphs in Computer Science: Data Structures and Applications
Delve into the world of graphs in computer science through this comprehensive guide from the University of Basrah. Learn about the fundamentals of graphs, their representations, connectivity, and examples, all taught by Instructor Ghazwan Abdulnabi Al-Ali. Gain insights into adjacency, paths, connec
1 views • 14 slides
Box Plots and Scatter Graphs for Data Analysis
Learn how to utilize box plots and scatter graphs to represent and compare large data sets effectively. Discover how to identify the five quartiles and measures of spread from a box plot, including quartiles Q0, Q1, Q2, Q3, Q4 and metrics such as the range and inter-quartile range.
3 views • 38 slides
Understanding Graphs in Mathematics
Learn about graphs in mathematics, including definitions, types, terminology, and special characteristics. Explore concepts such as simple graphs, multiple graphs, loops, directed and undirected graphs, and more. Dive into examples and homework exercises to enhance your understanding.
1 views • 31 slides
Visualizing Data Relationships Through Scatter Diagrams
Explore how scatter diagrams help analyze the relationship between variables using points on a graph, with a best-fit line indicating the strength and direction of the correlation. Follow the steps to plot monthly mean temperatures and vapor pressures to understand the distribution pattern, and comp
4 views • 22 slides
Interpreting Scatter Graphs and Line of Best Fit
Explore the use of scatter graphs and lines of best fit in predicting missing data. Understand correlations between variables, make estimations, and analyze relationships based on plotted points in various scenarios such as student test scores, men's mass and shoe size, and museum visitor numbers ve
1 views • 13 slides
Linear Regression and Scatter Diagrams
Explore the concepts of simple linear regression, scatter diagrams, and the relationship between variables with practical examples. Understand the parameters, calculations, and interpretations of data in a regression model. Visualize the connection between income and food expenditure through scatter
0 views • 40 slides
Understanding Scatter Plots: Analysis and Applications
Explore scatter plots and trend lines in algebra with examples and correlations explained. Learn to create, interpret, and make predictions using scatter plots.
0 views • 16 slides